

100% of COVID Statistics Are Wrong
Public policies for the most consequential pandemic are based on flawed data

Data is everything. If you get the data wrong, all the decisions, conclusions, medicines and public policies will be deeply flawed and even dangerous. We are still in the midst of the most disruptive pandemic, but all the data we have so far are wrong, partial, and mostly useless.
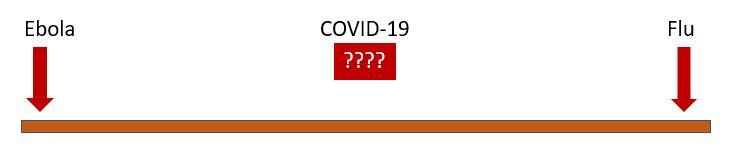
Precise data matters for risk-benefit analysis and optimal public policies. Treating Ebola like flu is as bad as treating flu like Ebola. So, where does the SARS-Cov-2 virus fall?
We don’t know the true numbers for cases, hospitalizations, deaths, case mortality rate, effectiveness of vaccines and medicines and so on. And it’s not like 10% or 20% uncertainty. We are talking absurd ranges of 300%. Let’s see why:
How dangerous is COVID19? Nobody knows!
This is the most important question for any disease, right? How bad is this? If 100 people get COVID, how many and who will die?
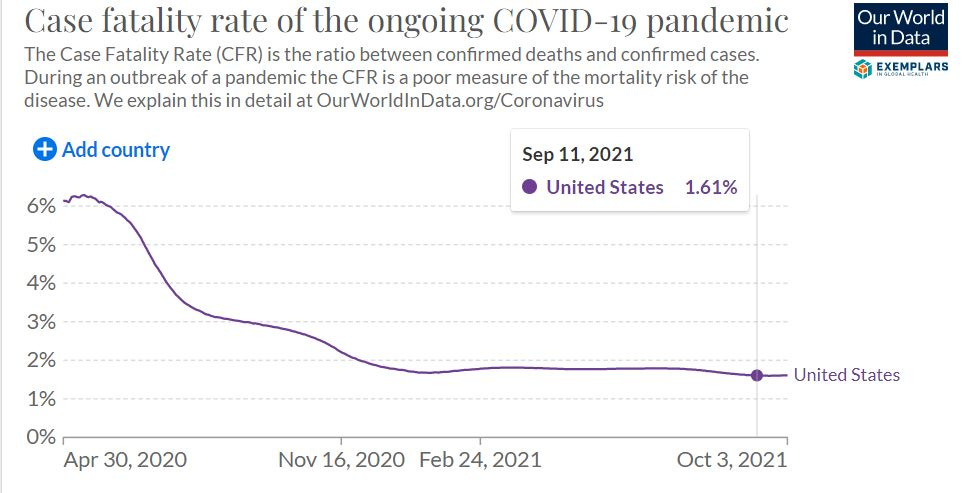
The answer is not easy. The official number for case fatality rate (CFR) in Oct 2021 was 1.6% in the United States. Looking at the chart below, and seeing how it varied from 6% to 1.6%, we can safely say the average CFR over the pandemic is about 2.5%
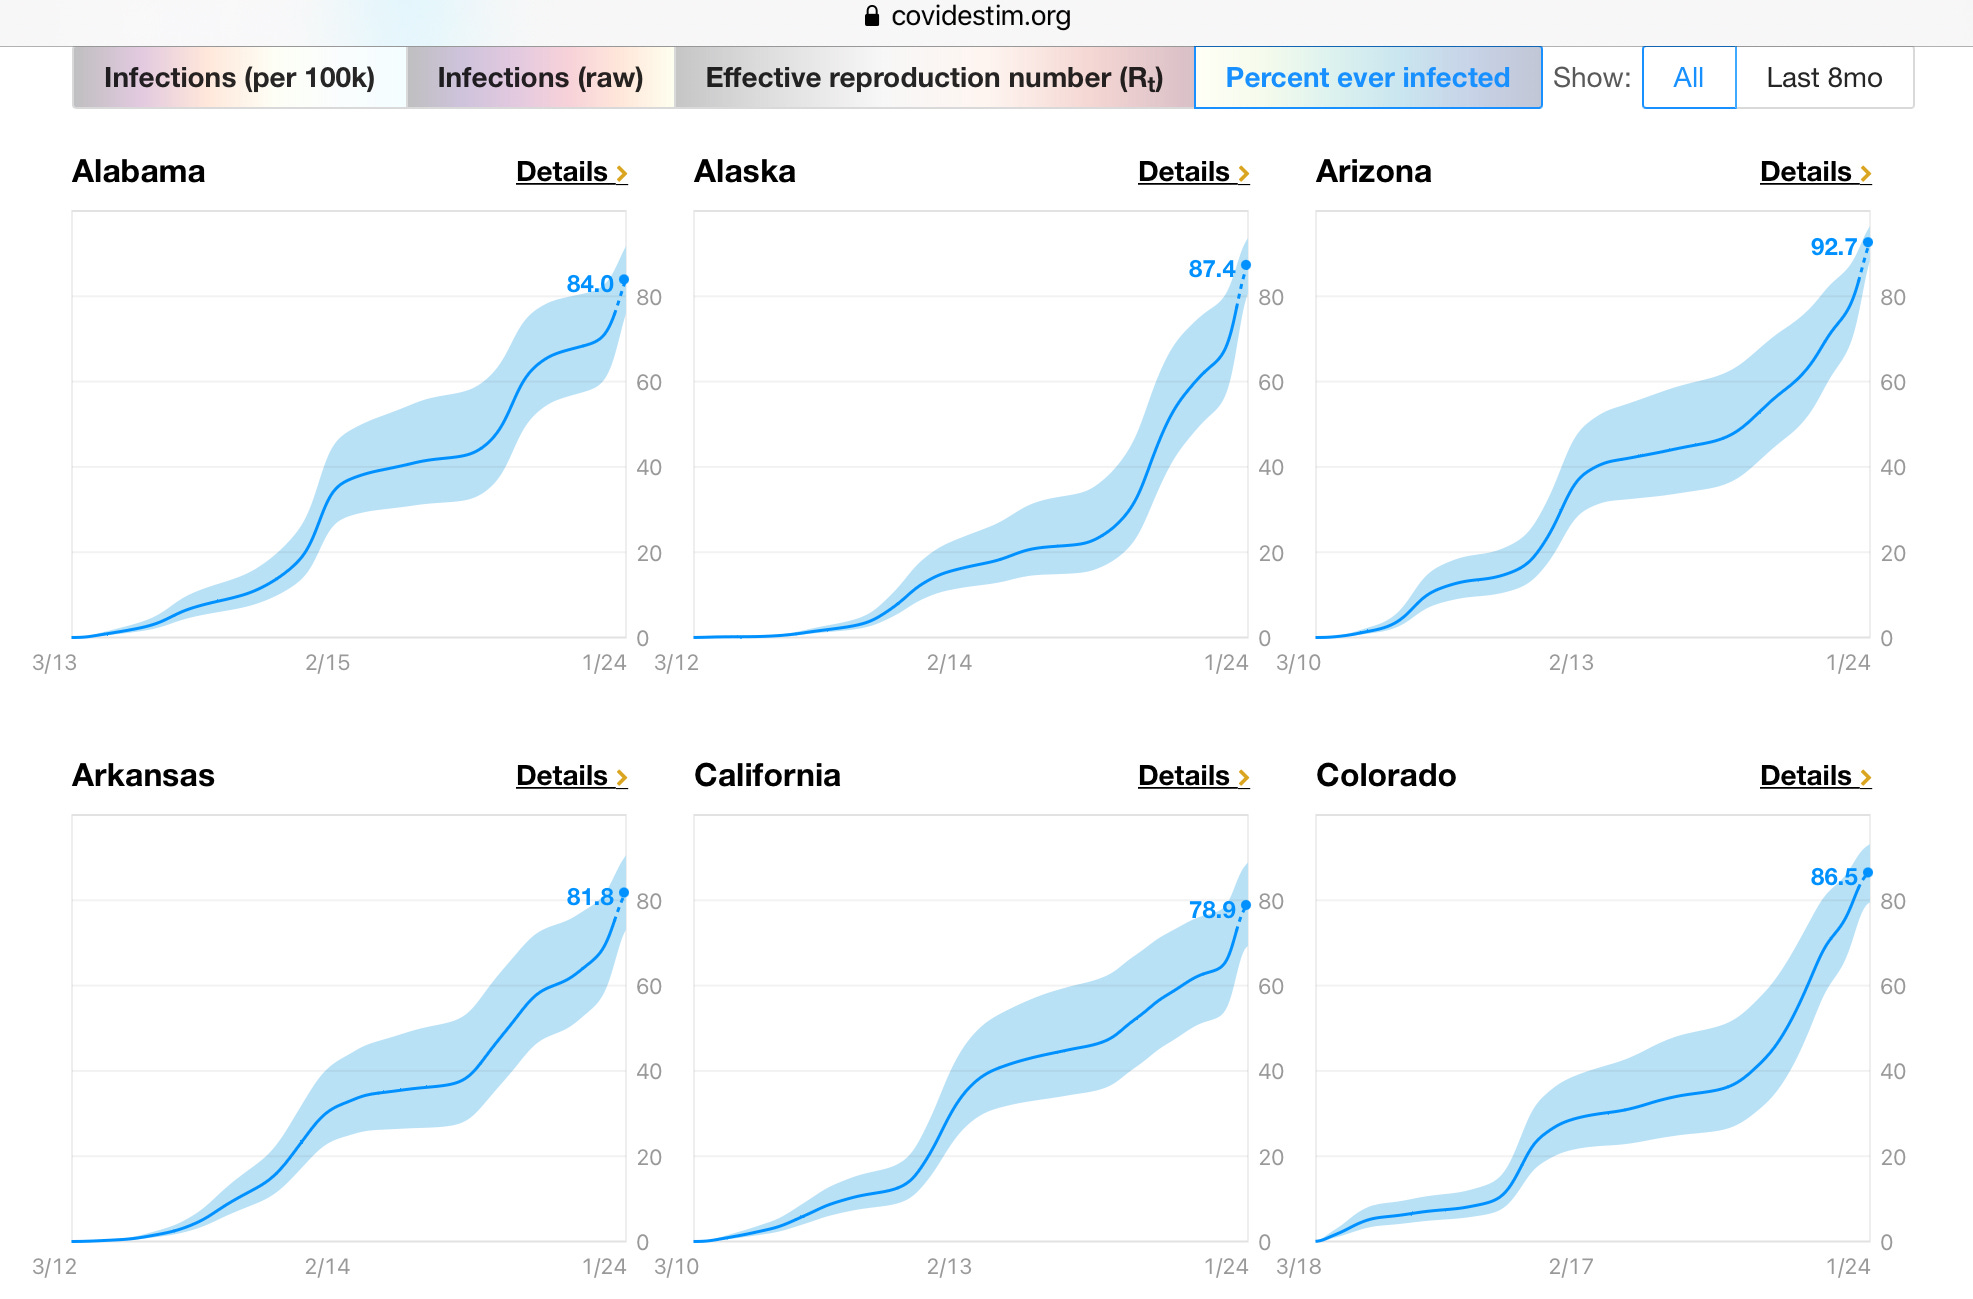
However, there is a new modeling tool called CovidEstim, that was developed by CDC, Stanford University and others. According to this, more than 80% of Americans have gotten COVID so far — i.e., 264 million Americans.
Now, do the math for case fatality rate: 850,000 dead out of 264 million — That translates to 0.32% case fatality rate.
(Remember that 40% of COVID19 cases are asymptomatic. These people almost never get tested. And another 20% or so have only mild symptoms and will never go to the hospital. Thus, the actual number of covid cases is a lot higher than the official number).
So, what is the CFR? 0.32% or 2.5%?
That’s not a small difference. That’s a staggering eight-fold difference! Like 100 versus 800.
How many cases? No Idea
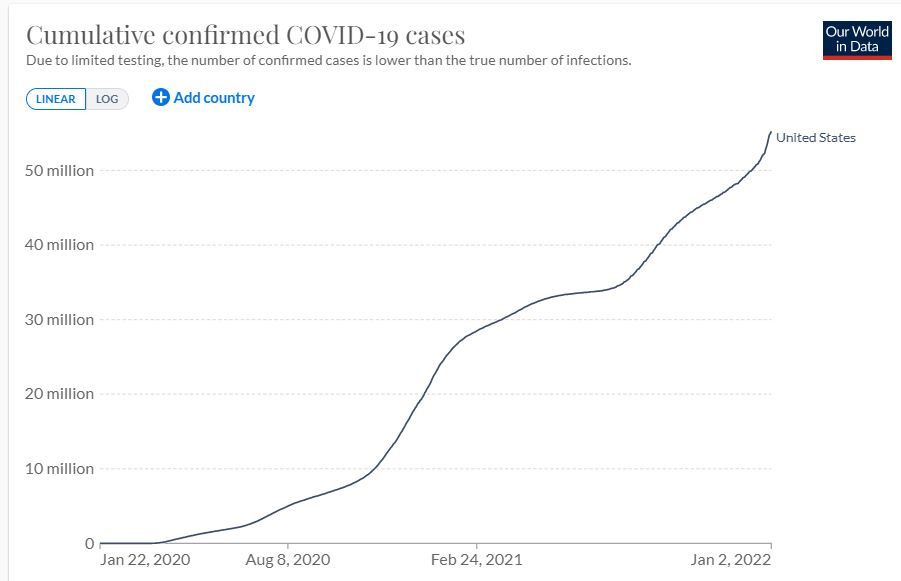
Again, the official number for cumulative Covid19 cases in the U.S. as of Jan 1, 2022 was 55 million.
However, as seen before, according to CDC’s modeling, there are 264 million cases.
So, which is it? 55 million or 264 million infected? Again, that’s a 4.8x difference!
How many hospitalized or died “with COVID” versus “due to COVID”?
This was once deemed a conspiracy theory — did people really die because of COVID, or did they just happen to have COVID? Now, after two years, authorities from Boston and New York to London and Dublin are admitting that 40-65% of all COVID hospitalizations and deaths are “incidental.”
That again, is a huge variation. If we extrapolate that to the entire pandemic, perhaps only 400,000 Americans died, and not 800,000. We might have exaggerated hospitalizations and deaths by whopping 100%!
If we go with 400K, the case mortality rate is 0.27%. That’s 1/6th the number for measles, which we managed without vaccines or draconian measures until the 1970s.
Here’s another shocker. Someone requested data on “COVID-only” deaths in the U.K. using the freedom of information act. The response was shocking: Only about 6,000 British had died just from COVID (until Dec 2021). That’s like 4% of the official deaths.
Even the CDC admits in its own website that only 5% of “COVID deaths” are caused by COVID alone — i.e., without any comorbidity. That is, only 42,000 Americans have died from “only COVID-19.” That’s a gamechanger.
Are PCR tests valid?
This again was once a conspiracy theory, but now Fauci and the CDC admit that PCR tests are not useful, since they (PCR tests) can show up positive for 12 weeks (3 months) after a person is infected.
This is like you failing the breath analyzer test on Monday morning for a glass of wine you had on Friday night. Basically, all the hysteria over the daily number of new cases — “casedemic” — over the last two years might have been practically junk data.
Vaccinated versus Unvaccinated Data
While the mainstream media constantly talk about the “pandemic of unvaccinated,” recent data from England, Scotland, and Canada show that the fully vaccinated account for 65-75% of the hospitalization and deaths (See my article: Worst. Vaccines. Ever). Hard to believe that there can be such a huge discrepancy between countries that are so similar in many ways.
Pfizer’s CEO said ,“Two doses of vaccines offer limited protection, if any” for omicron. But that’s not science. We need real numbers for vaccine efficacy.
Age-stratified Data
Here, we have accurate data, but the public policies do not have a true risk-benefit analysis. Take children (aged 0-17). The latest numbers from CDC show that the annual risk for an American child to die from COVID is 1 in 200,000. Do we have to vaccinate 200,000 children to save one life? Would it be smarter to have antiviral drugs and other treatments to save that one life? After all, vaccination also has its own risks — adverse reactions like myocarditis or even deaths.
Look how many children died from COVID, cancer, heart disease etc. over the last two years. (Source)
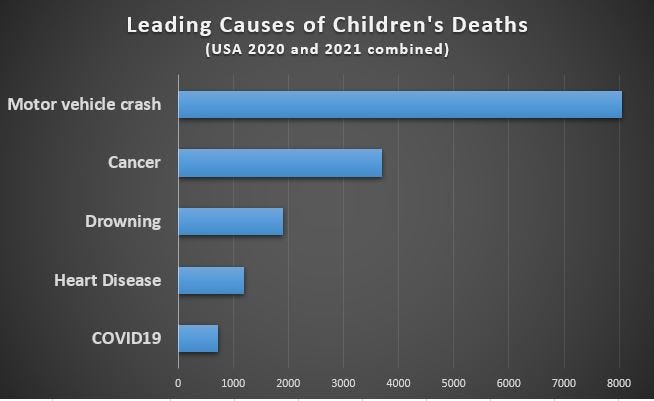
So, here are the annual probabilities of death from COVID-19 for different age groups:
People under the age of 40: 1 in 20,000
Kids under the age of 18: 1 in 200,000
Kids aged 5-14: 1 in 500,000
Again, scientists should weigh cost-benefit analysis for treatments versus vaccines and also consider age-based solutions.
Adverse Reactions. Myocarditis
These have become taboo topics in mainstream media. The dogma is this: Any bad news about vaccines could cause “vaccine hesitancy,” so we will just ignore them. This is not science. A new study in prestigious JAMA shows tremendous risk for myocarditis for young boys after getting the second dose of Pfizer. Here is a chart for Daily Sceptic:

These are not “anti-vaxx” messages but facts that should be included in the risk-benefit analysis, just as doctors and scientists would do for any drug.
Natural Immunity
As mentioned in the beginning, 4 out of 5 Americans have already gotten COVID. That means, they have natural immunity. Furthermore, even a CDC study admits that natural immunity is 6x better than vaccines in reducing hospitalization and death. Thus, people with natural immunity have no need for vaccines, which could have been used to save lives of the truly vulnerable in other parts of the world. There was also no need to impose vaccine mandates, or fire the unvaccinated from jobs or discriminate against them.
R0 - Is the Pandemic Over?
One of the most critical number is R0, the reproduction factor of the virus. If R0 is 2, it means that each infected person will pass on the virus to 2 other people. When R0 becomes less than 1, the disease will die out. Now, R0 for omicron is way below 1 (Source: CovidEstim). Public policies should reflect this and lift all the mandates and restrictions.

Conclusion
The confusion reigns in every aspect of the public policies. Take masks. In 2020, cloth and surgical masks were bad first and then became mandatory. Now, we are told that those masks are useless and we need N95. Wait, one year ago, this is what the CDC said: “They [N95] are very hard to breathe in when you wear them properly. They're very hard to tolerate when you wear them for long periods of time."
Same confusions with Ivermectin, monoclonal antibodies, supplements etc. There are all kinds of clinical and observational data to support the effectiveness of these treatments, but they get shot down by the authorities.
Politics, corporate interests, and incompetence are totally screwing up our response to the COVID-19 pandemic. Fake data means fake solutions. And we are all paying a terrible price.
Good stuff. You should definitely tackle the boring response of "more vaccinated people equal higher representation of vaccinated in hospital blah blah".
This is riddled with logical fallacies. One example of many: "Now, R0 for omicron is way below 1 (Source: CovidEstim). Public policies should reflect this and lift all the mandates and restrictions.". Could R0 be below 1 because of the mandates and restrictions and actually be above 1 if they are lifted? Answer: yes it's possible.